Ratings are one of the most popular kind of user-generated content. You can see it almost everywhere: in blogs, in social networks, in e-commerce websites.
Usually user sets score on some scale, e.g. from 1 to 10 or from 1 to 5.
Sometimes the user is offered only two options: thumbs up and thumbs down. There are actually three options, because he can avoid a vote.
And there can be only one option, for example ‘Like’ button in the Facebook.
Which scale is the best? It is a trade-off between precision and complication. To press ‘Like’ is easier for the user than to select an appropriate score on the 10-point scale, but ‘Like’ button is less informative.
The statistics can help us to make decision. YouTube has analyzed ratings of videos. Their users rated content on the 5-point scale. And as it turned out most ratings were 1 and 5. And 5 is a few times popular than 1.
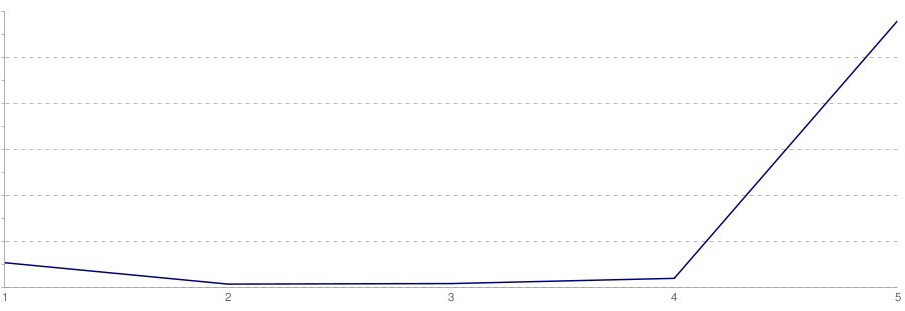
People rate the content only if it is very bad or it is very good. The meaning of these ratings are more clear than meaning of intermediate ones.
It turns out that the 5-point scale is too much complex and the up-down rating is good enough.
And even ‘Like’ button may be appropriate solution. But we should estimate difference in accuracy of the rating.
The accuracy is especially important if the ratings are used for prediction. For example, the Amazon uses ratings of products to make the recommendations.
The researchers from MIT say that the accuracy may be improved if the comparative scales will be used.